DEEP 2 Tutorial
This tutorial walks you through running the various steps of the pipeline for a single DEEP 2 dataset, which is a snapshot (~20 minutes on source), 16-dish MeerKAT observation of a radio-quiet patch of sky using the old ROACH-2 correlator, 11 GB in size. It was written for v1.0 of the pipeline during July 2020, but can be reproduced with v1.1 upwards by setting nspw=1.
To begin, ssh into the ilifu cluster (slurm.ilifu.ac.za), and create a working directory somewhere on the filesystem (e.g. /scratch/users/your_username/tutorial/).
1. Source setup.sh, which will add to your PATH and PYTHONPATH
source /idia/software/pipelines/master/setup.sh
2. Build a config file, using verbose mode, and pointing to the DEEP 2 dataset
processMeerKAT.py -B -C tutorial_config.txt -M /idia/projects/deep/1491550051.ms -v
You should get the following output, with different timestamps
2020-07-06 09:28:19,943 INFO: Extracting field IDs from MeasurementSet "/idia/projects/deep/1491550051.ms" using CASA.
2020-07-06 09:28:19,966 DEBUG: Using the following command:
	srun --time=10 --mem=4GB --partition=Main --qos qos-interactive singularity run /idia/software/containers/casa-stable-5.6.2-2.simg  /idia/software/pipelines/master/processMeerKAT/read_ms.py -B -M /idia/projects/deep/1491550051.ms -C tutorial_config.txt -N 1 -t 8 -v 2>&1 | grep -v 'msmetadata_cmpt.cc::open\|MSMetaData::_computeScanAndSubScanProperties\|MeasIERS::fillMeas(MeasIERS::Files, Double)\|Position:'
2020-07-06 09:29:25,672 INFO: Multiple fields found with intent "CALIBRATE_FLUX" in dataset "/idia/projects/deep/1491550051.ms" - [0 1].
2020-07-06 09:29:26,539 WARNING: Only using field "0" for "fluxfield", which has the most scans (1).
2020-07-06 09:29:26,540 WARNING: Putting extra fields with intent "CALIBRATE_FLUX" in "extrafields" - [1]
2020-07-06 09:29:26,541 INFO: Multiple fields found with intent "CALIBRATE_BANDPASS" in dataset "/idia/projects/deep/1491550051.ms" - [0 1].
2020-07-06 09:29:26,541 WARNING: Only using field "0" for "bpassfield", which has the most scans (1).
2020-07-06 09:29:26,541 INFO: Multiple fields found with intent "CALIBRATE_PHASE" in dataset "/idia/projects/deep/1491550051.ms" - [1 2].
2020-07-06 09:29:26,542 WARNING: Only using field "2" for "phasecalfield", which has the most scans (5).
2020-07-06 09:29:26,542 INFO: [fields] section written to "tutorial_config.txt". Edit this section if you need to change field IDs (comma-seperated string for multiple IDs, not supported for calibrators).
2020-07-06 09:29:27,156 DEBUG: Delta parang: 7.83458165019
2020-07-06 09:29:27,156 WARNING: Parallactic angle coverage is < 30 deg. Polarisation calibration will most likely fail, so setting dopol=False in [run] section of 'tutorial_config.txt'.
2020-07-06 09:29:27,163 INFO: Using reference antenna 'm059'.
2020-07-06 09:29:27,163 INFO: This is usually a well-behaved (stable) antenna. Edit 'tutorial_config.txt' to change this, by updating 'refant' in [crosscal] section.
2020-07-06 09:29:27,163 DEBUG: Alternatively, set 'calcrefant=True' in [crosscal] section of 'tutorial_config.txt', and include 'calc_refant.py' in 'scripts' in [slurm] section.
2020-07-06 09:29:27,847 WARNING: The number of threads (1 node(s) x 8 task(s) = 8) is not ideal compared to the number of scans (12) for "/idia/projects/deep/1491550051.ms".
2020-07-06 09:29:27,847 WARNING: Config file has been updated to use 1 node(s) and 6 task(s) per node.
2020-07-06 09:29:27,900 DEBUG: Overwritting [run] section in config file "tutorial_config.txt" with:
{'dopol': False}.
2020-07-06 09:29:27,917 DEBUG: Overwritting [slurm] section in config file "tutorial_config.txt" with:
{'ntasks_per_node': 6, 'nodes': 1}.
2020-07-06 09:29:27,939 DEBUG: Overwritting [fields] section in config file "tutorial_config.txt" with:
{'bpassfield': "'0'", 'fluxfield': "'0'", 'phasecalfield': "'2'", 'extrafields': "'1'", 'targetfields': "'3'"}.
2020-07-06 09:29:27,960 DEBUG: Overwritting [crosscal] section in config file "tutorial_config.txt" with:
{'spw': "'0:880.0~1680.0MHz'"}.
2020-07-06 09:29:29,617 INFO: Config "tutorial_config.txt" generated.
This calls CASA via the default singularity container without writing log files, and runs read_ms.py. It calls srun, requesting only 1 node, 1 task, 4 GB of memory, a 10 minute time limit, with interactive quality of service (qos) to increase the likelihood of launching srun immediately. The purpose of this call is to read the input MS and extract information used to build the pipeline run, such as the field IDs corresponding to our different fields, and the number of scans (to check against the nodes and tasks per node, each of which is handled by a MPI worker - see step 3). The output statements with DEBUG correspond to those output during [-v --verbose] mode. Warnings are display when multiple calibrator fields are present with the same intent, but only one is extracted, corresponding to the field with the most scans. In this case the extras fields are moved to extrafields (i.e. for applying calibration and imaging).
For more information about MPI and parallelism, see ilifu training slides (slides 12-16) and video.
3. View the config file created, which has the following contents:
[data]
vis = '/idia/projects/deep/1491550051.ms'

[fields]
bpassfield = '0'
fluxfield = '0'
phasecalfield = '2'
targetfields = '3'
extrafields = '1'

[slurm]
nodes = 1
ntasks_per_node = 6
plane = 1
mem = 232
partition = 'Main'
exclude = ''
time = '12:00:00'
submit = False
container = '/idia/software/containers/casa-stable-5.6.2-2.simg'
mpi_wrapper = '/idia/software/pipelines/casa-pipeline-release-5.6.1-8.el7/bin/mpicasa'
name = ''
dependencies = ''
account = 'b03-idia-ag'
reservation = ''
verbose = True
precal_scripts = [('calc_refant.py', False, ''), ('partition.py', True, '')]
postcal_scripts = [('concat.py', False, ''), ('plotcal_spw.py', False, '')]
scripts = [('validate_input.py', False, ''), ('flag_round_1.py', True, ''), ('calc_refant.py', False, ''), ('setjy.py', True, ''), ('xx_yy_solve.py', False, ''), ('xx_yy_apply.py', True, ''), ('flag_round_2.py', True, ''), ('xx_yy_solve.py', False, ''), ('xx_yy_apply.py', True, ''), ('split.py', True, ''), ('quick_tclean.py', True, ''), ('plot_solutions.py', False, '')]

[crosscal]
minbaselines = 4                  # Minimum number of baselines to use while calibrating
chanbin = 1                       # Number of channels to average before calibration (during partition)
width = 1                         # Number of channels to (further) average after calibration (during split)
timeavg = '8s'                    # Time interval to average after calibration (during split)
createmms = True                  # Create MMS (True) or MS (False) for cross-calibration during partition
keepmms = True                    # Output MMS (True) or MS (False) during split
spw = '0:880.0~1680.0MHz'
nspw = 16                         # Number of spectral windows to split into
calcrefant = False                # Calculate reference antenna in program (overwrites 'refant')
refant = 'm059'                   # Reference antenna name / number
standard = 'Stevens-Reynolds 2016'# Flux density standard for setjy
badants = []                      # List of bad antenna numbers (to flag)
badfreqranges = [ '933~960MHz',   # List of bad frequency ranges (to flag)
        '1163~1299MHz',
        '1524~1630MHz']

[run]
continue = True
dopol = False
This config file contains five sections - data, fields, slurm, crosscal, and run. The fields IDs that we just extracted, seen in section [fields], correspond to field 0 for the bandpass calibrator, field 0 for the total flux calibrator, field 2 for the phase calibrator, fields 3 for the science target (i.e. the DEEP 2 field) and field 1 for an extra calibrator field for which we’ll apply solutions and produce a quick-look image. Only the target and extra fields may have multiple fields, separated by a comma. If a field isn’t found according to its intent, a warning is displayed, and the field for the total flux calibrator is selected. If the total flux calibrator isn’t present, the program will display an error and terminate. The [run] section is used internally by the pipeline, and should be ignored.
The SLURM parameters in section [slurm] correspond to those seen by running processMeerKAT.py -h. The pipeline executes all the scripts from the scripts parameter in order, including any of your own that you can insert (see Advanced Usage). The precal_scripts and postcal_scripts are only relevant when nspw > 1 (the default is nspw=16), where as we will set nspw=1 for this tutorial, meaning that in the next step, the scripts in precal_scripts will be prepended to the beginning of scripts, and the scripts in postcal_scripts will be appended to the end of scripts.
By default, for this particular MS, for all threadsafe scripts (i.e. those with True in the list(s) of scripts), we use 1 node, 6 tasks per node, 232 GB of memory (per node), and plane=1 (an argument that distributes N tasks onto one node before moving onto next node). During step 2, only 12 scans were found, and since partition.py partitions the data into one sub-MeasurementSet (sub-MS) per scan, only 12 sub-MSs will exist in the multi-MeasurementSet (MMS - see step 10 below). Assuming that each observation has a phase calibrator bracketing each target scan, and includes at least one other calibrator scan (i.e. the bandpass/flux calibrator), at most, half the sub-MSs will be generally operated on at any given time, each handled by one MPI worker, and a master MPI worker (the MPIClient). So we aim to have a limit of nscans/2 threads, including the MPIClient. For this dataset, the limit is 6 threads, so read_ms.py attempts to match this number by starting with one node and increasing the number of tasks (and then nodes) until the number of threads is more than the limit, terminating at 1 nodes x 6 tasks per node = 6 threads.
For scripts that aren’t threadsafe (i.e. those with False in the list(s) of scripts), we use a single node, and a single task per node. For the majority scripts that are threadsafe and those that aren’t, we use a single CPU per task, and explicitly export OMP_NUM_THREADS=1, since there is no documentation or evidence of a speedup with more than one CPU per task. However, for partition.py we use between 2-4 CPUs per task (equal to the number of polarisations, which is 2 by default, but 4 if [-D --dopol] is used, which adds the xy_yx_solve.py or xy_yx_apply.py scripts to the scripts parameter in your config). Furthermore, quick_tclean.py will use as many CPUs as it can without exceeding 32 in total.
The cross-calibration parameters in section [crosscal] correspond to various CASA parameters passed into the calibration tasks that the pipeline uses, following an algorithm that is documented here. By default all frequency ranges listed in badfreqranges, and all antenna numbers listed in badants, will be flagged out entirely. If the calc_refant.py script is run by the pipeline (i.e. when calcrefant=True and calc_refant.py is in the list of scripts), this will likely change the value of refant, and possibly add a list of bad antennas to badants.
4. Edit your config file to set nspw=1, mem=5GB, postcal_scripts=[] and then run the pipeline using your config file
processMeerKAT.py -R -C tutorial_config.txt
You should get the following output, with different timestamps
2020-07-06 10:21:59,009 WARNING: Appending "precal_scripts" to beginning of "scripts", and "postcal_scripts" to end of "scripts", since nspw=1. Overwritting this in "tutorial_config.txt".
2020-07-06 10:21:59,661 DEBUG: Copying 'tutorial_config.txt' to '.config.tmp', and using this to run pipeline.
2020-07-06 10:21:59,773 WARNING: Changing [slurm] section in your config will have no effect unless you [-R --run] again.
2020-07-06 10:21:59,943 DEBUG: Wrote sbatch file "partition.sbatch"
2020-07-06 10:21:59,979 DEBUG: Wrote sbatch file "validate_input.sbatch"
2020-07-06 10:22:00,005 DEBUG: Wrote sbatch file "flag_round_1.sbatch"
2020-07-06 10:22:00,050 DEBUG: Wrote sbatch file "setjy.sbatch"
2020-07-06 10:22:00,162 DEBUG: Wrote sbatch file "xx_yy_solve.sbatch"
2020-07-06 10:22:00,195 DEBUG: Wrote sbatch file "xx_yy_apply.sbatch"
2020-07-06 10:22:00,256 DEBUG: Wrote sbatch file "flag_round_2.sbatch"
2020-07-06 10:22:00,301 DEBUG: Wrote sbatch file "xx_yy_solve.sbatch"
2020-07-06 10:22:00,358 DEBUG: Wrote sbatch file "xx_yy_apply.sbatch"
2020-07-06 10:22:00,405 DEBUG: Wrote sbatch file "split.sbatch"
2020-07-06 10:22:00,427 DEBUG: Wrote sbatch file "quick_tclean.sbatch"
2020-07-06 10:22:00,455 DEBUG: Wrote sbatch file "plot_solutions.sbatch"
2020-07-06 10:22:00,639 INFO: Master script "submit_pipeline.sh" written, but will not run.
A number of sbatch files have now been written to your working directory, each of which corresponds to the python script in the list of scripts set by the scripts parameter in our config file. Our config file was copied to .config.tmp, which is the config file written and edited by the pipeline, which the user should not touch. A logs directory was created, which will store the CASA and SLURM log files. Lastly, a bash script called submit_pipeline.sh was written, however, this script was not run, since we set submit = False in our config file (to immediately submit to the SLURM queue, you can change this in your config file, or by using option [-s --submit] when you build your config file with processMeerKAT.py). Normally, we would run ./submit_pipeline.sh to run the pipeline, and return later when it is completed. However, we will look at later, as we first want to get a handle of how the pipeline works.
5. View validate_input.sbatch, which has the following contents:
#!/bin/bash
#SBATCH --account=b03-idia-ag
#SBATCH --nodes=1
#SBATCH --ntasks-per-node=1
#SBATCH --cpus-per-task=1
#SBATCH --mem=5GB
#SBATCH --job-name=validate_input
#SBATCH --distribution=plane=1
#SBATCH --output=logs/%x-%j.out
#SBATCH --error=logs/%x-%j.err
#SBATCH --partition=Main
#SBATCH --time=12:00:00

export OMP_NUM_THREADS=$SLURM_CPUS_PER_TASK

srun singularity run /idia/software/containers/casa-stable-5.6.2-2.simg  /idia/software/pipelines/master/processMeerKAT/validate_input.py --config .config.tmp 2>&1 | grep -v 'msmetadata_cmpt.cc::open\|MSMetaData::_computeScanAndSubScanProperties\|MeasIERS::fillMeas(MeasIERS::Files, Double)\|Position:'
Since this script is not threadsafe, the job is called with srun, and is configured to run a single task on a single node. The last line shows the call of the validate_input.py script, which will validate the parameters in your config file.
6. Run the first sbatch job
sbatch validate_input.sbatch
You should see the following output, corresponding to your SLURM job ID
Submitted batch job 1491583
7. View your job in the SLURM queue (if you weren’t quick enough, repeat step 6, and quickly do step 7)
squeue
You will see something similar to the following, with other people’s jobs mixed into the queue.
  JOBID PARTITION     NAME     USER ST       TIME  NODES NODELIST(REASON)
1491583      Main validate jcollier  R       0:13      1 slwrk-121
We can see the job with name validate was submitted to SLURM worker node 121, amongst a number of jobs in the Main partition, the Jupyter Spawner partition, and possible other partitions. Your job may list (Priority), which means it is too low a priority to be run at this point, or (Resources), which means it is waiting for resources to be made available.
NOTE: You can view just your jobs with squeue -u your_username, an individual job with squeue -j 1491583, and just the jobs in the main partition with squeue -p Main. You can view which nodes are allocated, which are idle, which are mixed (i.e. partially allocated), and which are down in the Main partition with sinfo -p Main. Often it is good idea to check this before selecting your SLURM parameters. More more information, see the ilifu documentation
8. View partition.sbatch, which has the following contents:
#!/bin/bash
#SBATCH --account=b03-idia-ag
#SBATCH --nodes=1
#SBATCH --ntasks-per-node=6
#SBATCH --cpus-per-task=2
#SBATCH --mem=5GB
#SBATCH --job-name=partition
#SBATCH --distribution=plane=1
#SBATCH --output=logs/%x-%j.out
#SBATCH --error=logs/%x-%j.err
#SBATCH --partition=Main
#SBATCH --time=12:00:00

export OMP_NUM_THREADS=$SLURM_CPUS_PER_TASK

/idia/software/pipelines/casa-pipeline-release-5.6.1-8.el7/bin/mpicasa singularity exec /idia/software/containers/casa-stable-5.6.2-2.simg  casa --nologger --nogui --logfile logs/${SLURM_JOB_NAME}-${SLURM_JOB_ID}.casa -c /idia/software/pipelines/master/processMeerKAT/crosscal_scripts/partition.py --config .config.tmp
Here we see the same default SLURM parameters for threadsafe tasks, as discussed in step 3. We now use mpicasa as the MPI wrapper, since we are calling a threadsafe script partition.py, which calls CASA task mstransform, which partitions a selection of the data (e.g. selecting only frequencies specified by your spectral window with parameter spw in your config file) into your working directory. When createmms=True (the default), a multi-MeasurementSet (MMS) is created and the data are partitioned into several sub-MeasurementSets (sub-MSs - see step 10 below), otherwise a single MS is created.
9. Submit your job and watch it in the queue
sbatch partition.sbatch
Submitted batch job 1491788
squeue -j 1491788
You will see something similar to the following, showing that SLURM worker 101 is now being used.
  JOBID PARTITION     NAME     USER ST       TIME  NODES NODELIST(REASON)
1491788      Main partitio jcollier  R       0:02      1 slwrk-101
Wait until the job completes, before step 10.
10. View the contents of 1491550051.880.0~1680.0MHz.mms.
You should see 1491550051.880.0~1680.0MHz.mms, which corresponds to your multi-MeasurementSet (MMS). From now on, the pipeline operates on these data, rather than the raw data stored in /idia/projects/. Inside this MMS, you will find the same tables and metadata as in a normal MS, but you will also see a SUBMSS directory, which should have the following contents.
1491550051.880.0~1680.0MHz.mms.0000.ms	1491550051.880.0~1680.0MHz.mms.0004.ms	1491550051.880.0~1680.0MHz.mms.0008.ms
1491550051.880.0~1680.0MHz.mms.0001.ms	1491550051.880.0~1680.0MHz.mms.0005.ms	1491550051.880.0~1680.0MHz.mms.0009.ms
1491550051.880.0~1680.0MHz.mms.0002.ms	1491550051.880.0~1680.0MHz.mms.0006.ms	1491550051.880.0~1680.0MHz.mms.0010.ms
1491550051.880.0~1680.0MHz.mms.0003.ms	1491550051.880.0~1680.0MHz.mms.0007.ms	1491550051.880.0~1680.0MHz.mms.0011.ms
These are the 12 sub-MSs, partitioned by this observation’s 12 scans of the various fields.
If we now view the CASA log (logs/partition-1491788.casa), you will find a bunch of junk output from mpicasa (often including nominal “errors”, sometimes severe), and 13 calls of mstransform, corresponding to 12 MPI workers for your 12 sub-MSs, and the master MPIClient. The master call from the MPIClient is the same one written to the standard error log (logs/partition-1491788.err). Your standard output log (logs/partition-1491788.out) will contains 6 sets of output from CASA launching, corresponding to the 6 threads (i.e. 1 node x 6 tasks per node) and some junk output from mpicasa.
11. Edit your config file to run the next steps
Edit tutorial_config.txt to remove the tuples for the first two and last six scripts in the scripts parameter, update vis to the MMS and select the submit option, so it looks like the following:
[data]
vis = 1491550051.880.0~1680.0MHz.mms
  .
  .
[slurm]
  .
  .
submit = True
  .
  .
scripts = [('flag_round_1.py', True, ''), ('calc_refant.py', False, ''), ('setjy.py', True, ''), ('xx_yy_solve.py', False, ''), ('xx_yy_apply.py', True, '')]
12. Run the pipeline using your config file
processMeerKAT.py -R -C tutorial_config.txt
You should see the following output, with different timestamps
2020-07-06 13:47:18,390 DEBUG: Copying 'tutorial_config.txt' to '.config.tmp', and using this to run pipeline.
2020-07-06 13:47:18,608 WARNING: Changing [slurm] section in your config will have no effect unless you [-R --run] again.
2020-07-06 13:47:18,711 DEBUG: Wrote sbatch file "flag_round_1.sbatch"
2020-07-06 13:47:18,774 DEBUG: Wrote sbatch file "setjy.sbatch"
2020-07-06 13:47:18,833 DEBUG: Wrote sbatch file "xx_yy_solve.sbatch"
2020-07-06 13:47:18,878 DEBUG: Wrote sbatch file "xx_yy_apply.sbatch"
2020-07-06 13:47:19,127 INFO: Running master script "submit_pipeline.sh"
Copying tutorial_config.txt to .config.tmp, and using this to run pipeline.
Submitting flag_round_1.sbatch to SLURM queue with following command:
sbatch flag_round_1.sbatch
Submitting setjy.sbatch SLURM queue with following command
sbatch -d afterok:1491808 --kill-on-invalid-dep=yes setjy.sbatch
Submitting xx_yy_solve.sbatch to SLURM queue with following command
sbatch -d afterok:1491808,1491809 --kill-on-invalid-dep=yes xx_yy_solve.sbatch
Submitting xx_yy_apply.sbatch to SLURM queue with following command
sbatch -d afterok:1491808,1491809,1491810 --kill-on-invalid-dep=yes xx_yy_apply.sbatch
Submitted sbatch jobs with following IDs: 1491808,1491809,1491810,1491811
Run ./killJobs.sh to kill all the jobs.
Run ./summary.sh to view the progress.
Run ./findErrors.sh to find errors (after pipeline has run).
Run ./displayTimes.sh to display start and end timestamps (after pipeline has run).
Run ./cleanup.sh to remove MSs/MMSs from this directory (after pipeline has run).
As before, we see the sbatch files being written to our working directory. Since we set submit=True, submit_pipeline.sh has been run, and all output after that (without the timestamps) comes from this bash script. After the first job is run (sbatch flag_round_1.sbatch), each other job is run with a dependency on all previous jobs (e.g. sbatch -d afterok:1491808,1491809,1491810 --kill-on-invalid-dep=yes xx_yy_apply.sbatch). We can see this by calling squeue -u your_username, which shows those jobs (Dependency). submit_pipeline.sh then writes five job scripts, all of which are explained in the output, written to the jobScripts directory with a timestamp appended to the filename, and symlinked from your working directory. findErrors.sh finds errors after this pipeline run has completed, ignoring all MPI errors.
These tasks follow the first step of a two-step calibration process that is summarised here.
13. Run ./summary.sh
This script simply calls sacct for all jobs submitted within this pipeline run. You should get output similar to the following.
          JobID         JobName  Partition    Elapsed NNodes NTasks NCPUS  MaxDiskRead MaxDiskWrite             NodeList   TotalCPU    CPUTime     MaxRSS      State ExitCode
--------------- --------------- ---------- ---------- ------ ------ ----- ------------ ------------ -------------------- ---------- ---------- ---------- ---------- --------
1491808         flag_round_1          Main   00:05:55      1            6                                      slwrk-143   00:00:00   00:35:30               RUNNING      0:0
1491809         setjy                 Main   00:00:00      1            6                                  None assigned   00:00:00   00:00:00               PENDING      0:0
1491810         xx_yy_solve           Main   00:00:00      1            1                                  None assigned   00:00:00   00:00:00               PENDING      0:0
1491811         xx_yy_apply           Main   00:00:00      1            6                                  None assigned   00:00:00   00:00:00               PENDING      0:0
Those PENDING are the jobs with dependencies, or jobs waiting for resources. Once this pipeline run has completed, ./summary.sh should give output similar to the following.
          JobID         JobName  Partition    Elapsed NNodes NTasks NCPUS  MaxDiskRead MaxDiskWrite             NodeList   TotalCPU    CPUTime     MaxRSS      State ExitCode
--------------- --------------- ---------- ---------- ------ ------ ----- ------------ ------------ -------------------- ---------- ---------- ---------- ---------- --------
1491808         flag_round_1          Main   00:18:06      1            6                                      slwrk-143  07:45.358   01:48:36             COMPLETED      0:0
1491808.batch   batch                        00:18:06      1      1     6        8.90G        1.03G            slwrk-143  07:45.358   01:48:36      3.05G  COMPLETED      0:0
1491809         setjy                 Main   00:05:47      1            6                                      slwrk-140  00:53.310   00:34:42                FAILED      1:0
1491809.batch   batch                        00:05:47      1      1     6        8.45G        8.28G            slwrk-140  00:53.310   00:34:42      2.31G     FAILED      1:0
1491810         xx_yy_solve           Main   00:03:09      1            1                                      slwrk-134  01:22.545   00:03:09             COMPLETED      0:0
1491810.batch   batch                        00:03:09      1      1     1        0.23M        0.15M            slwrk-134  00:00.716   00:03:09      0.01G  COMPLETED      0:0
1491810.0       singularity                  00:03:09      1      1     1        7.66G        0.00G            slwrk-134  01:21.828   00:03:09      0.39G  COMPLETED      0:0
1491811         xx_yy_apply           Main   00:02:50      1            6                                      slwrk-118  01:57.609   00:17:00             COMPLETED      0:0
1491811.batch   batch                        00:02:50      1      1     6       12.56G        7.53G            slwrk-118  01:57.609   00:17:00      2.27G  COMPLETED      0:0
SLURM will most likely report the setjy job as FAILED, even though the job has not failed (see known issues).
14. View caltables directory
The calibration solution tables have been written to caltables/1491550051.880.0~1680.0MHz.*, including bcal, gcal, fluxscale and kcal, corresponding to the calibration solutions for bandpass, complex gains, flux-scaled complex gains, and delays, respectively.
15. Run ./displayTimes.sh
You should see output similar to the following, which shows this run took ~30 minutes to complete, the longest of which was flagging for ~18 minutes. In this particular run, there was a ~51 minute wait time after flag_round_1 had completed, before setjy was launched.
logs/flag_round_1-1491808.casa	logs/flag_round_1-1491808.err  logs/flag_round_1-1491808.out
2020-07-06 13:47:56
2020-07-06 14:05:36
logs/setjy-1491809.casa  logs/setjy-1491809.err  logs/setjy-1491809.out
2020-07-06 14:56:40
2020-07-06 15:02:15
logs/xx_yy_solve-1491810.casa  logs/xx_yy_solve-1491810.err  logs/xx_yy_solve-1491810.out
2020-07-06 15:02:39
2020-07-06 15:05:36,296
logs/xx_yy_apply-1491811.casa  logs/xx_yy_apply-1491811.err  logs/xx_yy_apply-1491811.out
2020-07-06 15:06:10
2020-07-06 15:08:46
16. Run ./findErrors.sh
You should see similar output to the following:
logs/flag_round_1-1491808.casa	logs/flag_round_1-1491808.err  logs/flag_round_1-1491808.out
logs/setjy-1491809.casa  logs/setjy-1491809.err  logs/setjy-1491809.out
error message you will receive is this one.
logs/xx_yy_solve-1491810.casa  logs/xx_yy_solve-1491810.err  logs/xx_yy_solve-1491810.out
2020-07-06 15:02:58	SEVERE	MeasTable::dUTC(Double) (file ../../measures/Measures/MeasTable.cc, line 4290)	Leap second table TAI_UTC seems out-of-date.
2020-07-06 15:02:58	SEVERE	MeasTable::dUTC(Double) (file ../../measures/Measures/MeasTable.cc, line 4290)+	Until the table is updated (see the CASA documentation or your system admin),
2020-07-06 15:02:58	SEVERE	MeasTable::dUTC(Double) (file ../../measures/Measures/MeasTable.cc, line 4290)+	times and coordinates derived from UTC could be wrong by 1s or more.
logs/xx_yy_apply-1491811.casa  logs/xx_yy_apply-1491811.err  logs/xx_yy_apply-1491811.out
The repeated error during the xx_yy_solve is a false positive error (see diagnosing errors).
17. Build a new config file pointing to your MMS, without verbose mode
processMeerKAT.py -B -C tutorial_config_part2.txt -M 1491550051.880.0~1680.0MHz.mms
This way we reset the list of scripts in our config file, and set verbose=False and submit=False. We will manually remove the scripts that we already ran in step 20, so leave the scripts parameter as is for now.
18. Edit your config file
Edit tutorial_config.txt once again to set nspw=1, mem=5GB, precal_scripts=[] and postcal_scripts=[].
19. Run the pipeline using your updated config file
processMeerKAT.py -R -C tutorial_config_part2.txt
Since we have set verbose=False and submit=False, the pipeline will not yet run, and you should see simplified output like the following:
2020-07-06 14:36:30,247 WARNING: Changing [slurm] section in your config will have no effect unless you [-R --run] again.
2020-07-06 14:36:30,759 INFO: Master script "submit_pipeline.sh" written, but will not run.
20. Edit submit_pipeline.sh
You will see in submit_pipeline.sh that each sbatch job is submitted on its own line, and that the job ID is extracted. Remove everything from #partition.sbatch to one line before #flag_round_2.sbatch (i.e. the previous jobs we already ran). Edit the line with the first sbatch call to replace +=, with = and remove -d afterok:$IDs --kill-on-invalid-dep=yes, since the first job does not have any dependencies. After this, submit_pipeline.sh should look like the following:
#!/bin/bash
cp tutorial_config_part2.txt .config.tmp

#flag_round_2.sbatch
IDs=$(sbatch flag_round_2.sbatch | cut -d ' ' -f4)

#xx_yy_solve.sbatch
IDs+=,$(sbatch -d afterok:$IDs --kill-on-invalid-dep=yes xx_yy_solve.sbatch | cut -d ' ' -f4)

#xx_yy_apply.sbatch
IDs+=,$(sbatch -d afterok:$IDs --kill-on-invalid-dep=yes xx_yy_apply.sbatch | cut -d ' ' -f4)

#split.sbatch
IDs+=,$(sbatch -d afterok:$IDs --kill-on-invalid-dep=yes split.sbatch | cut -d ' ' -f4)

#quick_tclean.sbatch
IDs+=,$(sbatch -d afterok:$IDs --kill-on-invalid-dep=yes quick_tclean.sbatch | cut -d ' ' -f4)

#plot_solutions.sbatch
IDs+=,$(sbatch -d afterok:$IDs --kill-on-invalid-dep=yes plot_solutions.sbatch | cut -d ' ' -f4)

#Output message and create jobScripts directory
echo Submitted sbatch jobs with following IDs: $IDs
mkdir -p jobScripts
   .
   .
   .
21. Run ./submit_pipeline.sh
Again, we see simplified output
Submitted sbatch jobs with following IDs: 1492690,1492691,1492692,1492693,1492694,1492695
Run ./killJobs.sh to kill all the jobs.
Run ./summary.sh to view the progress.
Run ./findErrors.sh to find errors (after pipeline has run).
Run ./displayTimes.sh to display start and end timestamps (after pipeline has run).
Run ./cleanup.sh to remove MSs/MMSs from this directory (after pipeline has run).
These job IDs comprise the new pipeline run we’ve just launched. So now ./summary.sh will display sacct for the new job IDs, similar to the following:
          JobID         JobName  Partition    Elapsed NNodes NTasks NCPUS  MaxDiskRead MaxDiskWrite             NodeList   TotalCPU    CPUTime     MaxRSS      State ExitCode
--------------- --------------- ---------- ---------- ------ ------ ----- ------------ ------------ -------------------- ---------- ---------- ---------- ---------- --------
1492690         flag_round_2          Main   00:05:00      1            6                                      slwrk-118   00:00:00   00:30:00               RUNNING      0:0
1492691         xx_yy_solve           Main   00:00:00      1            1                                  None assigned   00:00:00   00:00:00               PENDING      0:0
1492692         xx_yy_apply           Main   00:00:00      1            6                                  None assigned   00:00:00   00:00:00               PENDING      0:0
1492693         split                 Main   00:00:00      1            6                                  None assigned   00:00:00   00:00:00               PENDING      0:0
1492694         quick_tclean          Main   00:00:00      1           30                                  None assigned   00:00:00   00:00:00               PENDING      0:0
1492695         plot_solutions        Main   00:00:00      1            1                                  None assigned   00:00:00   00:00:00               PENDING      0:0
The five new ancillary (bash) jobScripts will now correspond to these six new job IDs. If you want to see the output from the jobScripts referring to the old pipeline runs, don’t worry, they’re still in the jobScripts directory with an older timestamp in the filename. Only the symlink in your working directory has been updated.
Wait until the run finishes before step 22. You may want to come back later, as it takes ~45 minutes.
22. View the pipeline output
After this pipeline run has completed, viewing the output of ./summary.sh or ./displayTimes.sh shows this run took ~45 minutes, including ~20 minutes for quick-look imaging all fields, and ~14 minutes for plotting (a known issue).
These new tasks follow the second step of a two step calibration process that is summarised on this page.
After split.py has run, you will see four new files
1491550051.880.0~1680.0MHz.0252-712.mms 1491550051.880.0~1680.0MHz.0408-65.mms 1491550051.880.0~1680.0MHz.1934-638.mms 1491550051.880.0~1680.0MHz.DEEP_2_off.mms
These correspond to the data split out from 1491550051.880.0~1680.0MHz.mms, for the bandpass/flux calibrator (0408-65), the phase calibrator (0252-712), the science target (DEEP_2_off), and an extra field (0408-65 - often used as a flux/bandpass calibrator). 1491550051.880.0~1680.0MHz.mms itself has roughly doubled in size, since it has added columns for corrected data (from applycal) and model data (from setjy). This file can be safely removed now, as the corrected data for the fields of interest have been split into their own MMSs, as listed above. If you remove it and later need to derive the same data, you could run partition, apply the solutions stored in caltables, and the flags stored in 1491550051.880.0~1680.0MHz.mms.flagversions, which together take up ~1.5 GB, compared to ~17 GB for the MMS.
23. View the images in the images directory
quick_tclean.py creates quick-look images (i.e. with no selfcal, w-projection, thresholding, multiscale, etc) with robust weighting 0, for all fields specified in the config file, creating 512x512 images of the calibrator and extra fields, and 2048x2048 images of the target field(s), both with 2 arcsec pixel sizes. For data with > 100 MHz bandwidth, two taylor terms are used, otherwise the ‘clark’ deconvolver is used.
Convert the quick-look image for the science target (DEEP_2_off) from FITS to a HDF5 file, so that we can inspect it with CARTA:
srun --mem=1GB --time=1 /carta_share/hdf_convert/run_hdf_converter -o /carta_share/users/your_username/1491550051.880.0~1680.0MHz_DEEP_2_off.im.hdf5 images/1491550051.880.0~1680.0MHz_DEEP_2_off.im.fits
Connect to https://carta.idia.ac.za/, and open 1491550051.880.0~1680.0MHz_DEEP_2_off.im.hdf5.
Alternatively, you can view the images by connecting to a compute/worker node (ensure you use ssh -YA when connecting to ilifu - see ilifu docs) with:
salloc --qos qos-interactive
and launch ds9 or CASA viewer, respectively with the syntax (replace /scratch/users/your_username/tutorial/ below):
singularity exec /idia/software/containers/SF-PY3-bionic.simg ds9 -log /scratch/users/your_username/tutorial/images/*fits
singularity exec /idia/software/containers/casa-stable-5.6.2-2.simg casa --nologger --log2term -c "viewer(infile='/scratch/users/your_username/tutorial/images/1491550051.880.0~1680.0MHz_DEEP_2_off.im.image.tt0'); raw_input()"
Here’s what your images of the flux calibrator (1934-638) and target (DEEP_2_off) should look like.
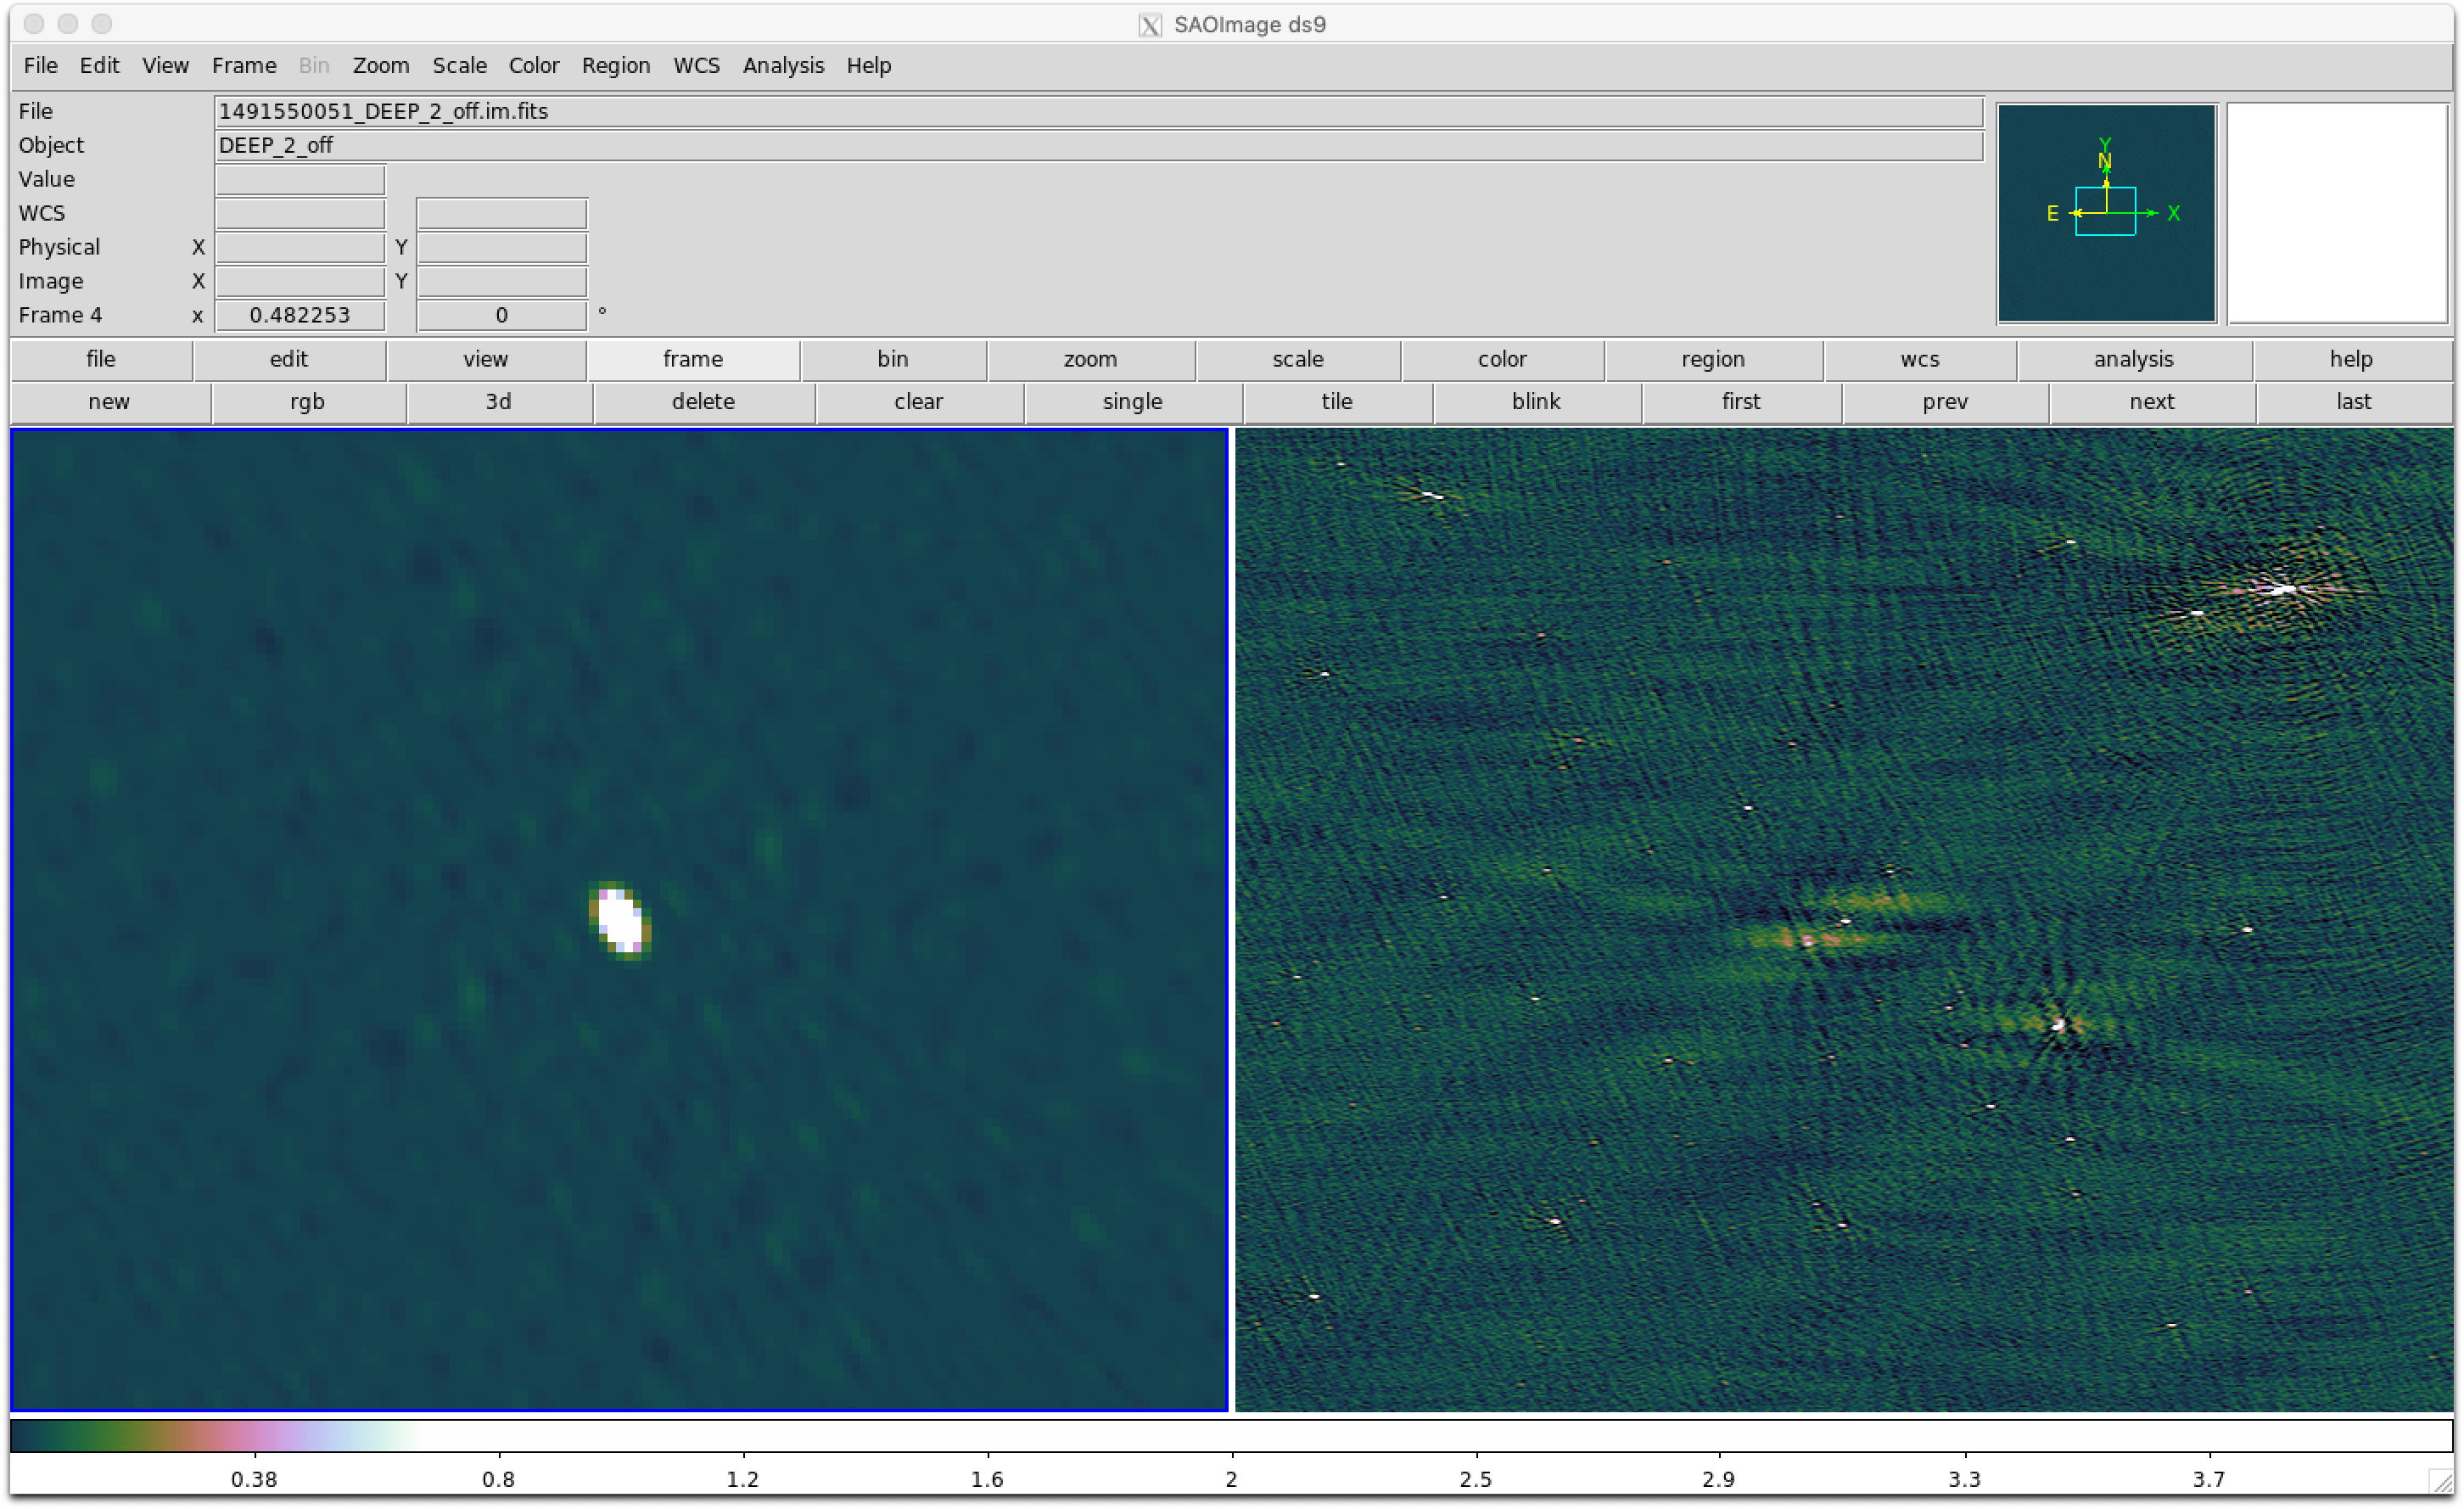
Since we imaged a snapshot 16-dish MeerKAT observation using the old ROACH-2 correlator, with an on source time of ~20 minutes, we do not get very good image quality. Below is a more typical image produced by quick_tclean.py for a 64-dish observation using the SKARAB correlator, spanning ~8 hours, and only 10 MHz bandwidth.

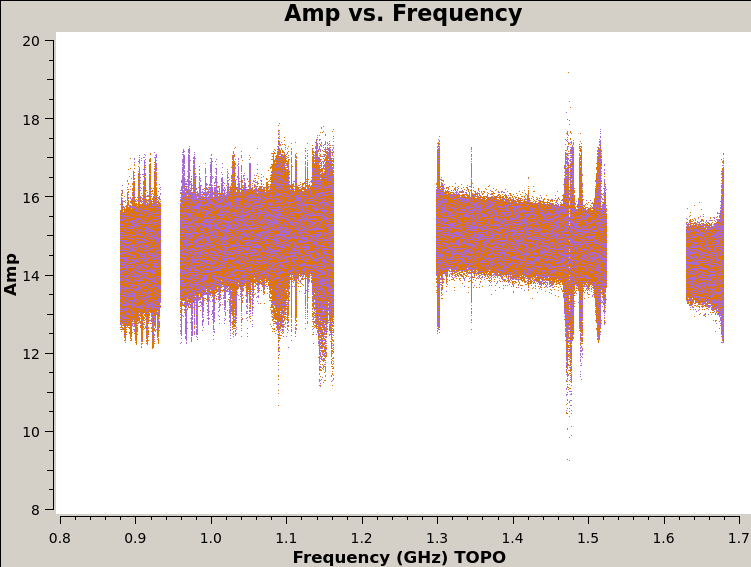
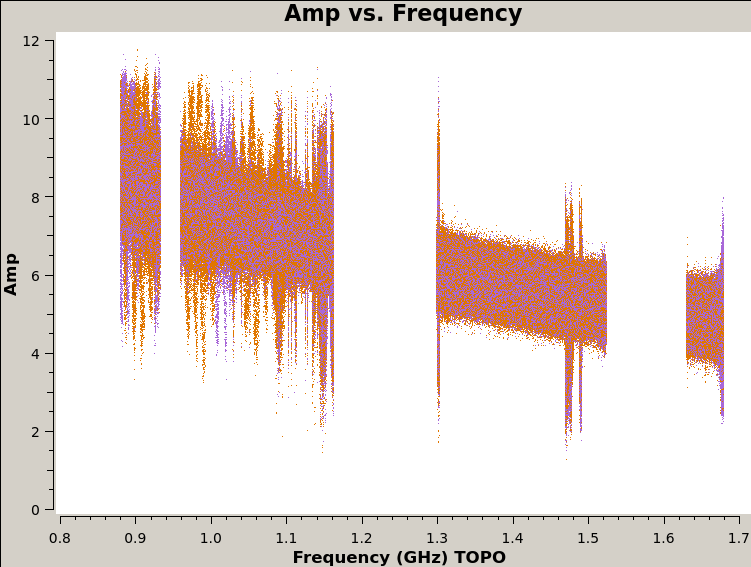
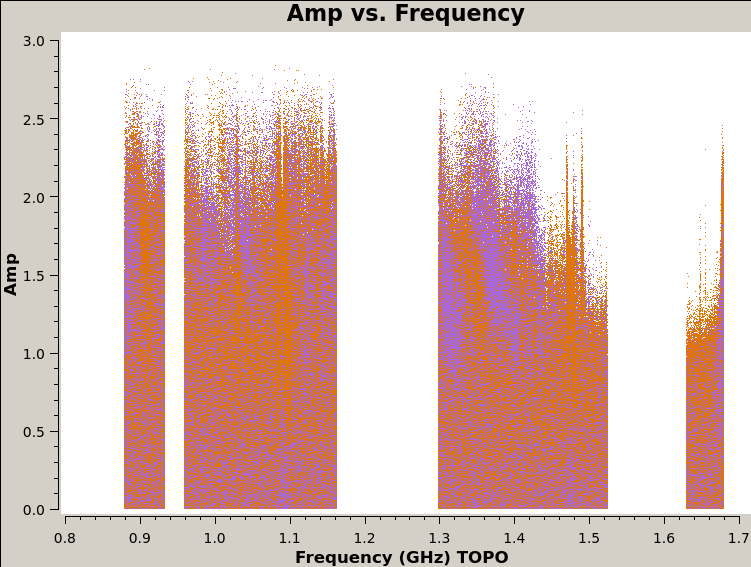
24. View the figures in plots directory
The last script that runs is plot_solutions.py, which calls CASA task plotms to plot the corrected data to eyeball for RFI. Below are a few selected plots.
That’s it! You have completed the tutorial! Now go forth and do some phenomenal MeerKAT science!